
Right Ventricular Hypertrophy ECG (RVH ECG)
In this article, Right Ventricular Hypertrophy ECG (RVH ECG) will be discussed in detail including pulmonary embolism, COPD and biventricular hypertrophy.
Right ventricular hypertrophy: Right ventricular hypertrophy (RVH) is recognized in the ECG by the following findings (Fig. 1).
Abnormalities in the QRS complex
- Right axis deviation of approximately ≥90°. This should always be present before the diagnosis of RVH is considered.
- qR complex in V1
- R wave measuring ≥7 mm in V1
- R wave taller than the S wave in V1 (R/S ratio ≥1)
- Delayed onset of the intrinsicoid deflection in V1
- >0.03 seconds
- rS complex from V1 to V6 with right axis deviation
- S1 S2 S3 pattern in adults
Abnormalities in the P wave
- Right atrial abnormality (P-pulmonale)
Abnormalities in the ST segment and T wave
- ST segment depression and T wave inversion in anterior precordial leads (V1 and V2)
- In adult patients, the thickness of the right ventricle seldom exceeds that of the left ventricle even when RVH is present. Because both ventricles are activated simultaneously, the forces generated by the right ventricle are masked by the forces generated by the left ventricle. Thus, the diagnosis of RVH by ECG may be difficult unless the right ventricle is severely hypertrophied.
- Types of RVH: The ECG manifestations of RVH may be different. Three different types have been described: types A, B, and C (Fig. 7.16).
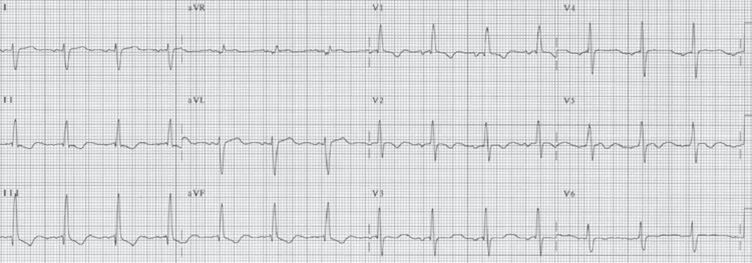
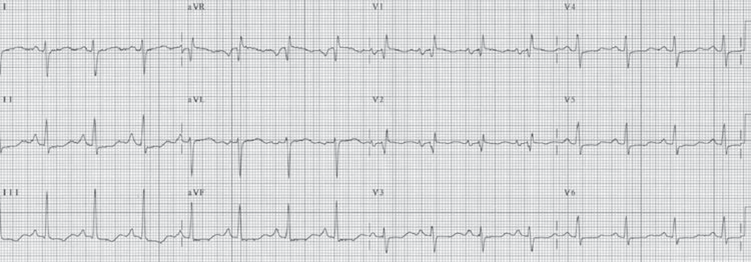
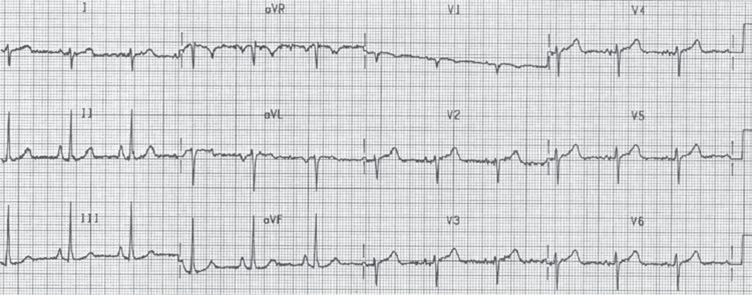
Figure 2: Right Ventricular Hypertrophy ECG (RVH ECG): Three types of right ventricular hypertrophy (RVH) are shown. (A) Type A RVH. (B) Type B RVH. (C) An example of type C RVH.
This is end of another section on Right Ventricular Hypertrophy ECG (RVH ECG). Scroll down to read another section on Right Ventricular Hypertrophy ECG (RVH ECG).
Other Patterns of RVH
Chronic pulmonary disease
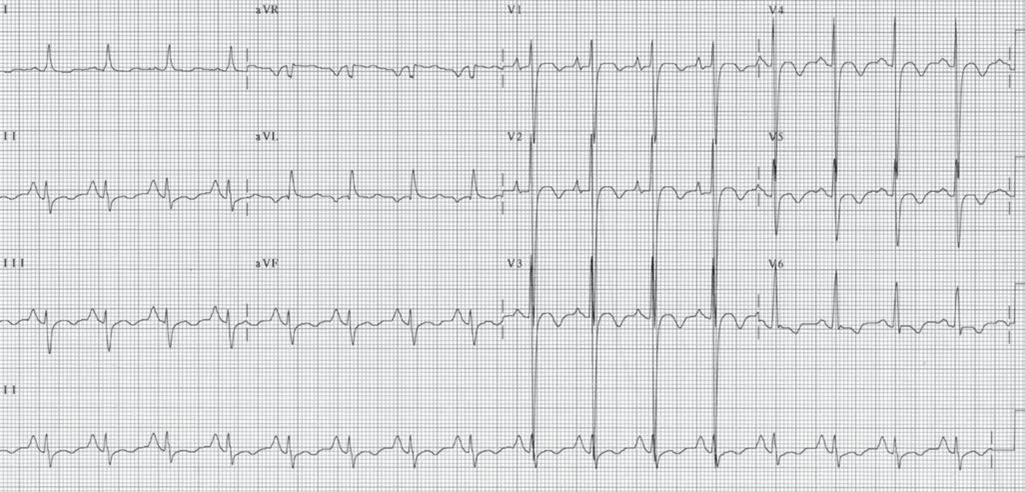
- When there is chronic obstructive pulmonary disease such as emphysema or chronic bronchitis, the overinflated lungs push the diaphragm downward, causing the heart to become vertically oriented. When this occurs, the axes of the P wave, QRS complex, and T wave are all shifted rightward and inferiorly toward lead aVF (90°), resulting in the so called “lead I sign.”
- Because lead I (0°) is perpendicular to lead aVF, lead I and often V6 will conspicuously show small deflections (Fig. 3) because the P, QRS, and T waves become isoelectric in these leads.
- The ventricles also rotate in a clockwise fashion, causing poor R wave progression and delay in the transition zone. Other signs of type C RVH like right axis deviation and P-pulmonale are usually present.
- S1 S2 S3 pattern: S1 S2 S3 pattern implies that S waves are present in leads I, II, and III. When the S1 S2 S3 pattern is present, the direction of the mean QRS axis is superior and to the right, away from leads II and aVF. This brings the main axis of the QRS complex to the northwest quadrant, as shown in the ECG in Figure 4.
- S1 S2 S3 pattern is not specific for RVH because it can occur normally in young children without any evidence of RVH or cardiac disease. In older individuals, this pattern is suggestive of RVH, especially when other signs of RVH such as right atrial enlargement (P-pulmonale) or prominent R waves are present in V1.
- Additionally, the size of the S waves in leads I, II, and III are usually deeper than the size of the R waves.
This is end of another section on Right Ventricular Hypertrophy ECG (RVH ECG). Scroll down to read another section on Right Ventricular Hypertrophy ECG (RVH ECG).
Acute Pulmonary Embolism
Acute pulmonary embolism: Acute pulmonary embolism may also result in acute right heart strain (Fig. 5). Most patients with acute pulmonary embolism are usually ill and restless and are therefore tachypneic and tachycardic. Sinus tachycardia and incomplete right bundle branch block are the most frequent ECG findings. The following are the ECG changes of acute pulmonary embolism.
Rhythm:
Sinus tachycardia, atrial flutter, or atrial fibrillation
Changes in the QRS complex:
- Right axis deviation of approximately ≥90°
- S1 Q3 T3 pattern (S wave in lead I, Q with inverted T wave in III)
- rSR’ pattern in V1 usually of acute onset
- V1 may also show QS, qR, or R > S pattern
- Clockwise rotation with persistent S in V6 similar to type C RVH
Changes in the P wave:
- P-pulmonale with peaking of the P waves in leads II, III, and aVF
- Ta waves become exaggerated in leads II, III, and aVF, causing 1 mm of ST depression in the inferior leads
Changes in the ST segment and T waves
- ST elevation in V1
- Inverted T waves in V1 to V3 or up to V6
This is end of another section on Right Ventricular Hypertrophy ECG (RVH ECG). Scroll down to read another section on Right Ventricular Hypertrophy ECG (RVH ECG).
Combined Ventricular Hypertrophy
Biventricular hypertrophy
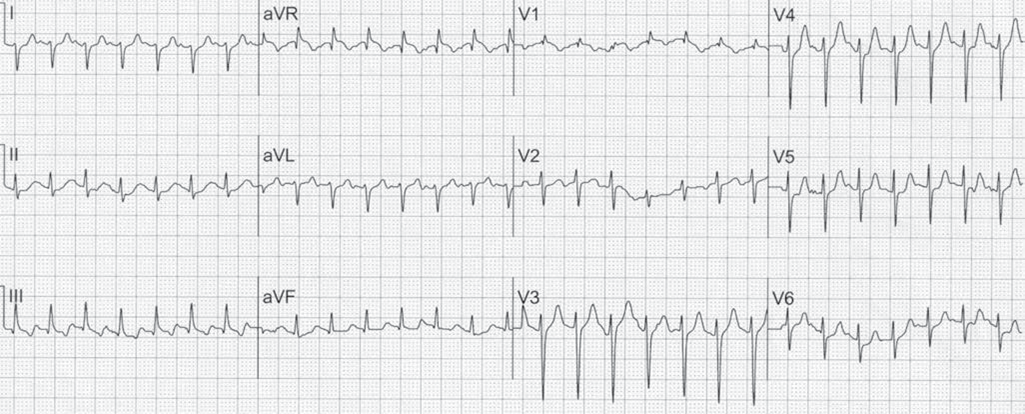
When both the right and left ventricles are hypertrophied, there is cancellation of the forces generated by both ventricles. Thus, the ECG may remain unchanged, and the diagnosis of biventricular hypertrophy is often difficult. Occasionally, the following ECG changes may be present as shown in Fig. 6.
- Tall biphasic complexes in mid-precordial leads:
- The transition leads V3 or V4 may show increased
- amplitude of the QRS complex with increased R waves combined with deep S waves (Katz-Wachtel phenomenon).
- Right atrial enlargement combined with LVH: LVH by any standard criteria combined with P pulmonale as shown in Fig. 7.20.
- Voltage discordance: Biventricular hypertrophy may also manifest as voltage discordance between the limb and precordial leads. Precordial leads are unipolar leads and are closer to the heart than the limb leads. Thus, tall QRS complexes are recorded in the precordial leads, whereas the limb leads, which are further away especially bipolar leads I, II, and III, will record low voltages.
This is end of another section on Right Ventricular Hypertrophy ECG (RVH ECG). Scroll down to read another section on Right Ventricular Hypertrophy ECG (RVH ECG).
ECG Findings in RVH
Abnormalities in the QRS complexes
- Right axis deviation of approximately ≥90°. This should always be present before the diagnosis of RVH is considered.
- qR in V1
- R wave in V1 ≥7 mm
- Tall R waves in V1 or V2 (R/S ratio ≥1)
- Delayed intrinsicoid deflection in V1 or V2 >0.03 seconds.
- rS complex from V1 to V6 (clockwise rotation) with right axis deviation
- S1 S2 S3 pattern in adult patients
- rSR’ or RBBB in V1 with right axis deviation
Abnormalities in the P waves
- Peaked P waves in leads II, III and aVF (P-pulmonale)
Abnormalities in the ST segment and T waves
- ST depression and T wave inversion in right sided precordial leads (V1)
- T wave inversion in V2 to V6
This is end of another section on Right Ventricular Hypertrophy ECG (RVH ECG). Scroll down to read another section on Right Ventricular Hypertrophy ECG (RVH ECG).
Mechanism
- Because of its thinner wall and smaller mass, the right ventricle does not contribute significantly to the generation of the QRS complex.
- Thus, when the ventricles are synchronously activated, the forces generated from the right ventricle are masked by those generated from the left ventricle.
- When there is RVH, the right ventricular wall becomes thickened and the right ventricular mass is increased, resulting in a larger contribution of the right ventricle in generating the QRS complex.
- In adults, the thickness of the right ventricle does not exceed that of the left ventricle even when RVH is present, thus the ECG changes of RVH continue to be masked by the forces generated by the thicker left ventricle.
- In certain types of congenital heart diseases, however, the RV wall is much thicker than the LV wall, such as in tetralogy of Fallot or in congenital pulmonary stenosis. When this occurs, the ECG findings of RVH become more obvious.
- Changes in the frontal or limb leads: RVH is better appreciated in the precordial leads than the limb leads because the precordial leads overlie the ventricles directly. Nevertheless, there are certain changes in the limb leads that may suggest RVH.
- Right axis deviation: Right axis deviation is one of the most reliable signs in the diagnosis of RVH. Because the right ventricle is anterior and to the right of the left ventricle, increase in right ventricular mass will shift the QRS axis to the right and anteriorly. Thus, the axis of the QRS complex is shifted toward 80° to 120° or further to the right when RVH is present. RVH is the most common cause of right axis deviation in the adult. The diagnosis of RVH is unlikely unless the axis of the QRS complex is shifted to the right.
S1 S2 S3 pattern: This pattern simply means that there is an S wave in lead I, lead II, and lead III. The presence of S waves in these leads is due to the terminal forces of the QRS complex being oriented rightward and superiorly toward the northwest quadrant. This is due to activation of the posterobasal portion of the right ventricle terminally.
The presence of S1 S2 S3, however, is not always diagnostic of RVH because it is also seen in normal healthy individuals, especially the younger age group. When there is S1 S2 S3 pattern, RVH may be present when other changes in the QRS complex are present, such as tall R waves in V1, P-pulmonale, or when the S waves are deeper than the size of the R waves in all three leads.
- Abnormalities of the P wave: Right atrial enlargement is a frequent accompaniment of right ventricular enlargement. Thus, the presence of peaked P waves with increased amplitude (P-pulmonale), best recorded in leads II, III, and aVF suggest RVH unless the P wave changes are due to tricuspid stenosis, which is rare in adults.
- Changes in the precordial leads: Because the precordial leads are directly on top of the ventricles, more information is provided by these leads when compared with the more distal limb leads.
- Tall R waves in V1 or V2 with R/S ratio ≥1: Increased voltage in the right-sided precordial leads occur when there is increased thickness of the right ventricular wall. This will be recorded as tall R waves in V1 or V2 with R/S ratio ≥1. R/S ratio ≥1 means that the height of the R wave in V1 is equal to or higher in amplitude than the S wave, which is the reverse of normal in the adult population.
- rS complex from V1 to V6 with right axis deviation: This is also called clockwise rotation or delayed transition. Deep S waves or rS complex from V1 to V6 may be due to RVH or LVH. For RVH to be present there should also be right axis deviation.
- When RVH is present, the right ventricle rotates anteriorly, causing the left ventricle to rotate in a more posterior orientation.
- If the ventricles are viewed from below looking upward, the rotation of both ventricles will be clockwise when there is right ventricular enlargement.
- Because the precordial leads are recorded in their standard location from V1 to V6, the transition zone is not crossed unless the electrodes are moved to the left and more posteriorly.
- This type of RVH is frequently associated with chronic lung disease (type C RVH).
- Prolonged ventricular activation time with delayed onset of the intrinsicoid deflection in V1 or V2. When the ventricular activation time is prolonged, the onset of the intrinsicoid deflection is delayed. The ventricular activation time of the right ventricle is measured in V1 from the onset of the QRS complex to the peak of the R or R’ wave and represents the time required for the impulse to activate the right ventricular wall.
- The ventricular activation time of the right ventricle normally measures ≤0.03 seconds and is increased to ≥0.04 seconds when there is right ventricular hypertrophy.
- The onset of the intrinsicoid deflection, measured in V1 or V2, represents the time when the electrical impulse has reached the right ventricular epicardium and generally coincides with the peak of the R wave or immediately thereafter, when the R wave is deflected downward toward baseline.
This is end of another section on Right Ventricular Hypertrophy ECG (RVH ECG). Scroll down to read next section on Right Ventricular Hypertrophy ECG (RVH ECG).
Clinical Significance of Right Ventricular Hypertrophy ECG (RVH ECG)
- In adults, RVH can result from many different causes. RVH may be due to pressure overload such as pulmonic stenosis or primary pulmonary hypertension.
- This type of RVH predominantly results in increased thickness of the right ventricle. It may also be due to volume overload such as atrial septal defect and tricuspid or pulmonic regurgitations, resulting in volume overload with dilatation of the right ventricular cavity.
- RVH can also result from the presence of lung disease, which may distort the anatomical relationship between the heart and the chest wall. Or it may be due to left heart failure where an increase in left ventricular mass is associated with an increase in right ventricular mass. These changes may develop insidiously or abruptly, as when pulmonary hypertension occurs in the setting of acute pulmonary embolism.
- The ECG presentations of RVH, therefore, in these different clinical settings are not necessarily similar. Different patterns of RVH have been described which includes types A, B, and C based on the morphology of the QRS complex in the precordial leads.
- Types A and B are easy to recognize as RVH because the size of the R wave is taller than the S wave in V1, whereas in type C the size of the R wave is smaller than the S wave in V1 and may not be recognized as RVH. In all three types, the axis of the QRS complex is shifted to the right.
- Type A RVH: This is the most recognizable type of RVH. The R waves are tall in V1, often in V2 and V3. The R wave is usually monophasic (no S wave) in V1. If an S wave is present, the R wave is always taller than the height of the S wave with an R/S ratio >1. V5 and V6 may show deeper S waves than R waves. In type A RVH, the thickness of the right ventricle is greater than the thickness of the left ventricle, and the right ventricle is the dominant ventricle.
- This type of RVH is the most commonly recognized and is seen in severe pulmonic stenosis, primary pulmonary hypertension, or mitral stenosis with severe pulmonary hypertension. The axis of the QRS complex is significantly deviated to the right at approximately +120°.
- Type B RVH: The R wave in V1 is slightly taller than the S wave or the ratio between the R wave and S wave is ≥1. V1 may also exhibit an rsr’ pattern. The QRS complex in V5 and V6 is not different from normal. This type of RVH is usually due to atrial septal defect or mitral stenosis with mild to moderate pulmonary hypertension. The frontal axis is vertical at approximately 90°.
- Type C RVH: This type of RVH is difficult to recognize and is frequently missed because the R wave in V1 is not tall and is smaller than the S wave. Instead, a deep S wave is present in V1 and in V2 that extends up to V6. Thus, V1 to V6 will show rS complexes. In V6, the R wave continues to be smaller in amplitude than the S wave. The axis of the QRS complex is approximately 90° or less. This type of RVH is usually due to chronic obstructive lung disease but could also occur acutely as a manifestation of acute pulmonary embolism.
- Prolongation of the QRS complex usually does not occur when there is RVH because the thickness of the right ventricle wall usually does not exceed that of the left ventricle, even when RVH is present. Thus, the forces generated by the right ventricle are cancelled by the forces from the left ventricle. When widening of the QRS complex is present, there may be associated right bundle branch block because the right bundle branch is very susceptible to injury when there is increased right ventricular pressure.
- The right ventricle is to the right and anterior to that of the left ventricle. Pulsations from the right ventricle are not normally visible or palpable. However, when the right ventricle is enlarged or hypertrophied, a sustained systolic precordial impulse is palpable along the left parasternal area. Prominent “a” waves are seen in the neck veins. Very often, tricuspid regurgitation is also present causing a “cv” wave in the jugular neck veins accompanied by prominent pulsations of the liver or the ear lobes bilaterally. Third and fourth gallop sounds may also be audible along the lower left sternal border. Their right ventricular origin can be verified by increase in intensity of these gallop sounds with inspiration.
This is end of another section on Right Ventricular Hypertrophy ECG (RVH ECG). Scroll down to read another section on Right Ventricular Hypertrophy ECG (RVH ECG).
Treatment and Prognosis
When RVH is present, the underlying cause should be evaluated. The treatment and prognosis will depend on the etiology of the RVH.
That is all about Right Ventricular Hypertrophy ECG (RVH ECG). We have discussed Right Ventricular Hypertrophy ECG (RVH ECG) in detail and evan covered topics like ECG in Acute Pulmonary Embolism and in COPD and Biventricular hypertrophy also.
Related ECG articles
References
New England Journal of Medicine