
This is an article about the basic principles of ECG which include normal and abnormal P wave, QRS complex, T wave and U waves. I hope you’ll enjoy reading this article.
It is printed on grid paper called the ECG strip or ECG tracing. The process of producing an electrocardiogram is termed electrocardiography. It is a non-invasive medical procedure performed by recording the cardiac impulses on the surface of our body using specialized electrodes over specific regions of our body.
Basic Principles of ECG- P Wave
P wave Overview:
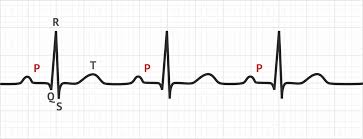
The P wave is the first positive deflection on the ECG and represents atrial depolarisation
- The P wave is the first positive deflection on the ECG
- It represents atrial depolarisation
- Duration: < 0.12 s (<120ms or 3 small squares)
Morphology
- Smooth contour
- Monophasic in lead II
- Biphasic in V1
Axis
- Normal P wave axis is between 0° and +75°
- P waves should be upright in leads I and II, inverted in aVR
Duration
- < 0.12 s (<120ms or 3 small squares)
Amplitude
- < 2.5 mm (0.25mV) in the limb leads
- < 1.5 mm (0.15mV) in the precordial leads
Atrial abnormalities are most easily seen in the inferior leads (II, III and aVF) and lead V1, as the P waves are most prominent in these leads.
The Atrial Waveform – Relationship to the P wave
- Atrial depolarisation proceeds sequentially from right to left, with the right atrium activated before the left atrium.
- The right and left atrial waveforms summate to form the P wave.
- The first 1/3 of the P wave corresponds to right atrial activation, the final 1/3 corresponds to left atrial activation; the middle 1/3 is a combination of the two.
- In most leads (e.g. lead II), the right and left atrial waveforms move in the same direction, forming a monophasic P wave.
- However, in lead V1 the right and left atrial waveforms move in opposite directions. This produces a biphasic P wave with the initial positive deflection corresponding to right atrial activation and the subsequent negative deflection denoting left atrial activation.
- This separation of right and left atrial electrical forces in lead V1 means that abnormalities affecting each individual atrial waveform can be discerned in this lead. Elsewhere, the overall shape of the P wave is used to infer the atrial abnormality.
Right Atrial Enlargement – Lead II
- In right atrial enlargement, right atrial depolarisation lasts longer than normal and its waveform extends to the end of left atrial depolarisation.
- Although the amplitude of the right atrial depolarisation current remains unchanged, its peak now falls on top of that of the left atrial depolarisation wave.
- The combination of these two waveforms produces a P waves that is taller than normal (> 2.5 mm), although the width remains unchanged (< 120 ms).
Left Atrial Enlargement – Lead II
- In left atrial enlargement, left atrial depolarisation lasts longer than normal but its amplitude remains unchanged.
- Therefore, the height of the resultant P wave remains within normal limits but its duration is longer than 120 ms.
- A notch (broken line) near its peak may or may not be present (“P mitrale”).
Basic Principles of ECG- Right Atrial Enlargement – Lead V1
Right atrial enlargement causes increased height (> 1.5mm) in V1 of the initial positive deflection of the P wave
Basic Principles of ECG- Left Atrial Enlargement – Lead V1
Left atrial enlargement causes widening (> 40ms wide) and deepening (> 1mm deep) in V1 of the terminal negative portion of the P wave.
Biatrial enlargement is diagnosed when criteria for both right and left atrial enlargement are present on the same ECG. The spectrum of P-wave changes in leads II and V1 with right, left and bi-atrial enlargement is summarised in the following diagram:
Common P wave abnormalities include:
- P mitrale (bifid P waves), seen with left atrial enlargement.
- P pulmonale (peaked P waves), seen with right atrial enlargement.
- P wave inversion, seen with ectopic atrial and junctional rhythms.
- Variable P wave morphology, seen in multifocal atrial rhythms.
1.P Mitrale
The presence of broad, notched (bifid) P waves in lead II is a sign of left atrial enlargement, classically due to mitral stenosis.
2. P Pulmonale
The presence of tall, peaked P waves in lead II is a sign of right atrial enlargement, usually due to pulmonary hypertension (e.g. cor pulmonale from chronic respiratory disease).
3. Inverted P Waves
P-wave inversion in the inferior leads indicates a non-sinus origin of the P waves. When the PR interval is < 120 ms, the origin is in the AV junction (e.g. accelerated junctional rhythm):
When the PR interval is ≥ 120 ms, the origin is within the atria (e.g.ectopic atrial rhythm):
4. Variable P-Wave Morphology
The presence of multiple P wave morphologies indicates multiple ectopic pacemakers within the atria and/or AV junction. If ≥ 3 different P wave morphologies are seen, then multifocal atrial rhythm is diagnosed;
If ≥ 3 different P wave morphologies are seen and the rate is ≥ 100, then multifocal atrial tachycardia (MAT) is diagnosed.
This section was all about P waves in Basic Principles of ECG. Happy Learning.
Basic Principles of ECG- QRS Complex
Basic principles of ECG are very important to learn in order to begin reading ECG. No matter how complicated or tough an ECG is, most difficult ECGs can be cracked if one understands the basic principles of ECG.

Main Features to Consider
- Width of the complexes: Narrow versus broad.
- Voltage (height) of the complexes.
- Spot diagnoses: Specific morphology patterns that are important to recognise.
QRS Width
Normal QRS width is 70-100 ms (a duration of 110 ms is sometimes observed in healthy subjects). The QRS width is useful in determining the origin of each QRS complex (e.g. sinus, atrial, junctional or ventricular).
- Narrow complexes (QRS < 100 ms) are supraventricular in origin.
- Broad complexes (QRS > 100 ms) may be either ventricular in origin, or due to aberrant conduction of supraventricular complexes (e.g. due to bundle branch block, hyperkalaemia or sodium-channel blockade).
Sinus rhythm with frequent ventricular ectopic beats(VEBs) in a pattern of ventricular bigeminy. The narrow beats are sinus in origin, the broad complexes are ventricular.
Narrow QRS Complex Morphology:
Narrow (supraventricular) complexes arise from three main places:
- Sino-atrial node (= normal P wave)
- Atria (= abnormal P wave / flutter wave / fibrillatory wave)
- AV node / junction (= either no P wave or an abnormal P wave with a PR interval < 120 ms)
Broad QRS Complex Morphology:
Broad/Wide QRS Complexes
- A QRS duration > 100 ms is abnormal
- A QRS duration > 120 ms is required for the diagnosis of bundle branch block or ventricular rhythm
Broad complexes may be ventricular in origin or due to aberrant conduction secondary to:
- Bundle branch block (RBBB or LBBB)
- Hyperkalaemia
- Poisoning with sodium-channel blocking agents (e.g. tricyclic antidepressants)
- Pre-excitation (i.e. Wolff-Parkinson-White syndrome)
- Ventricular pacing
- Hypothermia
- Intermittent aberrancy (e.g. rate-related aberrancy)
Ventricular vs supraventricular rhythms:-
Differentiation between ventricular complexes and aberrantly conducted supraventricular complexes may be difficult.
- In general, aberrant conduction of sinus rhythm and atrial rhythms (tachycardia, flutter, fibrillation) can usually be identified by the presence of preceding atrial activity (P waves, flutter waves, fibrillatory waves).
- However, aberrantly conducted junctional (AV nodal) complexes may appear identical to ventricular complexes as both produce broad QRS without any preceding atrial activity.
- In the case of ectopic beats, this distinction is not really important (as occasional ectopic beats do not usually require treatment).
- However, in the case of sustained tachyarrhythmias, the distinction between ventricular tachycardia and SVT with aberrancy becomes more important.
Fortunately, many causes of broad QRS can be identified by pattern recognition:
- Right bundle branch block produces an RSR’ pattern in V1 and deep slurred S waves in the lateral leads.
- Left bundle branch block produces a dominant S wave in V1 with broad, notched R waves and absent Q waves in the lateral leads.
- Hyperkalaemia is associated with a range of abnormalities including peaked T waves
- Tricyclic poisoning is associated with sinus tachycardia and tall R’ wave in aVR
- Wolff-Parkinson White syndrome is characterised by a short PR interval and delta waves
- Ventricular pacing will usually have visible pacing spikes
- Hypothermia is associated with bradycardia, long QT, Osborn waves and shivering artefact
High Voltage QRS Morphology
- Increased QRS voltage is often taken to infer the presence of left ventricular hypertrophy.
- However, high left ventricular voltage (HLVV) may be a normal finding in patients less than 40-45 years of age, particularly slim or athletic individuals.
- There are multiple “voltage criteria” for left ventricular hypertrophy.
- Probably the most commonly used are the Sokolov-Lyon criteria (S wave depth in V1 + tallest R wave height in V5-V6 > 35 mm).
- Voltage criteria must be accompanied by non-voltage criteria to be considered diagnostic of left ventricular hypertrophy.
Low Voltage QRS Morphology
The QRS is said to be low voltage when:
- The amplitudes of all the QRS complexes in the limb leads are < 5 mm; or
- The amplitudes of all the QRS complexes in the precordial leads are < 10 mm
Electrical Alternans
- This is when the QRS complexes alternate in height.
- The most important cause is massive pericardial effusion, in which the alternating QRS voltage is due to the heart swinging back and forth within a large fluid-filled pericardium.
This section was all about QRS complex in Basic Principles of ECG. Happy Learning.
Basic Principles of ECG- T wave

The T wave is the positive deflection after each QRS complex.It represents ventricular repolarisation.
Characteristics of the normal T wave
- Upright in all leads except aVR and V1
- Amplitude < 5mm in limb leads, < 10mm in precordial leads (10mm in men, 8mm in women)
T wave abnormalities
- Peaked T waves
- Hyperacute T waves
- Inverted T waves
- Biphasic T waves
- ‘Camel Hump’ T waves
- Flattened T waves
1.Peaked T waves:
Tall, narrow, symmetrically peaked T-waves are characteristically seen in hyperkalaemia.
2. Hyperacute T waves:
Broad, asymmetrically peaked or ‘hyperacute’ T-waves are seen in the early stages of ST-elevation MI (STEMI) and often precede the appearance of ST elevation and Q waves.They are also seen with Prinzmetal angina.Loss of precordial T-wave balanceLoss of precordial T-wave balance occurs when the upright T wave is larger than that in V6. This is a type of hyperacute T wave.The normal T wave in V1 is inverted. An upright T wave in V1 is considered abnormal — especially if it is tall (TTV1), and especially if it is new (NTTV1).This finding indicates a high likelihood of coronary artery disease, and when new implies acute ischemia.
3. Inverted T waves:
Inverted T waves are seen in the following conditions:Normal finding in childrenPersistent juvenile T wave patternMyocardial ischaemia and infarctionBundle branch blockVentricular hypertrophy (‘strain’ patterns)Pulmonary embolismHypertrophic cardiomyopathyRaised intracranial pressure** T wave inversion in lead III is a normal variant. New T-wave inversion (compared with prior ECGs) is always abnormal. Pathological T wave inversion is usually symmetrical and deep (>3mm).
4. Biphasic T waves:
There are two main causes of biphasic T waves:Myocardial ischaemiaHypokalaemiaThe two waves go in opposite directions:Biphasic T waves due to ischaemia – T waves go UP then DOWN
Biphasic T waves due to Hypokalaemia – T waves go DOWN then UP
5. Camel hump’ T waves:
‘Camel hump’ T waves is a term used by Amal Mattu to describe T-waves that have a double peak. There are two causes for camel hump T waves:
- Prominent U waves fused to the end of the T wave, as seen in severe hypokalaemia
- Hidden P waves embedded in the T wave, as seen in sinus tachycardia and various types of heart block
6. Flattened T waves:
Flattened T waves are a non-specific finding, but may representischaemia (if dynamic or in contiguous leads) orelectrolyte abnormality, e.g. hypokalaemia (if generalised).1. IschaemiaDynamic T-wave flattening due to anterior ischaemia (above). T waves return to normal once the ischaemia resolves (below).2. HypokalaemiaNote generalised T-wave flattening in hypokalaemia associated with prominent U waves in the anterior leads (V2 and V3).
This section was all about T waves in Basic Principles of ECG. Happy Learning.
Basic Principles of ECG- U Wave

Overview of U wave:
- The U wave is a small (0.5 mm) deflection immediately following the T wave
- U wave is usually in the same direction as the T wave.
- U wave is best seen in leads V2 and V3.
Source of the U wave:
The source of the U wave is unknown. Three common theories regarding its origin are:
- Delayed repolarisation of Purkinje fibres
- Prolonged repolarisation of mid-myocardial “M-cells”
- After-potentials resulting from mechanical forces in the ventricular wall
Features of Normal U waves:
- The U wave normally goes in the same direction as the T wave
- U -wave size is inversely proportional to heart rate: the U wave grows bigger as the heart rate slows down
- U waves generally become visible when the heart rate falls below 65 bpm
- The voltage of the U wave is normally < 25% of the T-wave voltage: disproportionally large U waves are abnormal
- Maximum normal amplitude of the U wave is 1-2 mm
Abnormalities of the U wave:
- Prominent U waves
- Inverted U waves
1. Prominent U waves:-
U waves are described as prominent if they are
- >1-2mm or 25% of the height of the T wave.
Causes of prominent U waves; Prominent U waves most commonly found with:
- Bradycardia
- Severe hypokalaemia.
Prominent U waves may be present with:
- Hypocalcaemia
- Hypomagnesaemia
- Hypothermia
- Raised intracranial pressure
- Left ventricular hypertrophy
- Hypertrophic cardiomyopathy
Drugs associated with prominent U waves:
- Digoxin
- Phenothiazines (thioridazine)
- Class Ia antiarrhythmics (quinidine, procainamide)
- Class III antiarrhythmics (sotalol, amiodarone)
Note many of the conditions causing prominent U waves will also cause a long QT.
2. Inverted U waves:
- U-wave inversion is abnormal (in leads with upright T waves)
- A negative U wave is highly specific for the presence of heart disease
Common causes of inverted U waves
- Coronary artery disease
- Hypertension
- Valvular heart disease
- Congenital heart disease
- Cardiomyopathy
- Hyperthyroidism
In patients presenting with chest pain, inverted U waves:
- Are a very specific sign of myocardial ischaemia
- May be the earliest marker of unstable angina and evolving myocardial infarction
- Have been shown to predict a ≥ 75% stenosis of the LAD / LMCA and the presence of left ventricular dysfunction.
This section was all about U waves in Basic Principles of ECG. Happy Learning.
This article was all about basic principles of ECG. We discussed normal and abnormal P wave, QRS complex, T wave and U waves.
I hope you learned well about basic principles of ECG.